WnioskowanieStatystyczne/Interpretacja współczynnika korelacji: Różnice pomiędzy wersjami
| (Nie pokazano 21 pośrednich wersji utworzonych przez tego samego użytkownika) | |||
| Linia 9: | Linia 9: | ||
[[Plik:Wsp kor war.png|500px]] | [[Plik:Wsp kor war.png|500px]] | ||
| − | |||
<math> | <math> | ||
| Linia 22: | Linia 21: | ||
</math> | </math> | ||
| − | Całkowitą wariancję zmiennej <math>y</math> | + | |
| + | |||
| + | Całkowitą wariancję zmiennej <math>y</math> można podzielić na dwa | ||
człony: wariancję estymaty <math>y_{i}^{p}</math> wokół wartości | człony: wariancję estymaty <math>y_{i}^{p}</math> wokół wartości | ||
średniej <math>\overline{y}</math> i wariancję obserwowanych | średniej <math>\overline{y}</math> i wariancję obserwowanych | ||
| Linia 29: | Linia 30: | ||
| + | <center> | ||
<math> | <math> | ||
\underset{i=1}{\overset{N}{\sum }}(y_{i}-\overline{y})^{2}= | \underset{i=1}{\overset{N}{\sum }}(y_{i}-\overline{y})^{2}= | ||
| Linia 34: | Linia 36: | ||
\overset{N}{\sum }}(y_{i}^{p}-\overline{y})^{2} | \overset{N}{\sum }}(y_{i}^{p}-\overline{y})^{2} | ||
</math> | </math> | ||
| + | </center> | ||
| + | |||
===Współczynnik korelacji liniowej (Pearsona)=== | ===Współczynnik korelacji liniowej (Pearsona)=== | ||
| − | + | Rozważmy stosunek wariancji tłumaczonej przez model do całkowitej wariancji | |
| − | + | <center> | |
| − | + | :<math> | |
| − | + | S^2 = | |
| − | <math> | + | \dfrac{\underset{i=1}{\overset{N}{\sum }}(y_{i}^{p}-\overline{y})^{2}} |
| − | + | {\underset{i=1}{\overset{N}{\sum }}(y_i-\overline{y})^{2}} | |
| − | \overline{y})}{\underset{i=1}{\overset{N}{\sum }}( | ||
| − | |||
</math> | </math> | ||
| + | </center> | ||
| + | podstawiając <math>y_i^p = a + b x_i</math> dostajemy | ||
| − | + | :<math> S^2 = | |
| − | + | \dfrac{\underset{i=1}{\overset{N}{\sum }}(a + b x_i-\overline{y})^{2}} | |
| − | + | {\underset{i=1}{\overset{N}{\sum }}(y_i-\overline{y})^{2}} | |
| − | |||
| − | <math> | ||
| − | |||
| − | |||
| − | {\ | ||
</math> | </math> | ||
| − | + | Ponieważ <math>\overline{y} = a + b \overline{x}</math>, czyli <math>a=\overline{y}-b\overline{x}</math>, | |
| − | <math> | + | :<math> S^2 = |
| − | + | \dfrac{\underset{i=1}{\overset{N}{\sum }}(\overline{y}-b\overline{x} + b x_i-\overline{y})^{2}} | |
| − | \overline{x}) | + | {\underset{i=1}{\overset{N}{\sum }}(y_i-\overline{y})^{2}} |
| − | \sum }}( | + | = |
| − | \overline{y})^{2}} | + | \dfrac{\underset{i=1}{\overset{N}{\sum }}b^2(x_i-\overline{x})^2} |
| + | {\underset{i=1}{\overset{N}{\sum }}(y_i-\overline{y})^{2}} | ||
| + | = | ||
| + | b^2\dfrac{\underset{i=1}{\overset{N}{\sum }}(x_i-\overline{x})^2} | ||
| + | {\underset{i=1}{\overset{N}{\sum }}(y_i-\overline{y})^{2}} | ||
</math> | </math> | ||
| − | + | Skoro prosta <math>y= a + b x</math> została dopasowana metodą największej wiarygodności, to <math> | |
| − | <math> | ||
| − | |||
| − | b | ||
| − | </math>, | ||
| − | <math> | ||
b=\frac{\underset{i=1}{\overset{N}{\sum }}(x_{i}-\overline{x})(y_{i}- | b=\frac{\underset{i=1}{\overset{N}{\sum }}(x_{i}-\overline{x})(y_{i}- | ||
\overline{y})}{\underset{i=1}{\overset{N}{\sum }}(x_{i}-\overline{x})^{2}} | \overline{y})}{\underset{i=1}{\overset{N}{\sum }}(x_{i}-\overline{x})^{2}} | ||
| + | </math>, czyli | ||
| + | |||
| + | :<math> S^2 = | ||
| + | b^2 \,\,\, \dfrac{\underset{i=1}{\overset{N}{\sum }}(x_i-\overline{x})^2} | ||
| + | {\underset{i=1}{\overset{N}{\sum }}(y_i-\overline{y})^{2}} | ||
| + | = | ||
| + | \dfrac | ||
| + | {\left(\underset{i=1}{\overset{N}{\sum }}(x_{i}-\overline{x})(y_{i}- | ||
| + | \overline{y})\right)^2} | ||
| + | {\left(\underset{i=1}{\overset{N}{\sum }}(x_{i}-\overline{x})^{2}\right)^2} | ||
| + | \;\;\; | ||
| + | \dfrac{\underset{i=1}{\overset{N}{\sum }}(x_i-\overline{x})^2} | ||
| + | {\underset{i=1}{\overset{N}{\sum }}(y_i-\overline{y})^{2}} | ||
</math> | </math> | ||
| + | <math> | ||
| + | S^2 = | ||
| + | \dfrac | ||
| + | {\left(\underset{i=1}{\overset{N}{\sum }}(x_{i}-\overline{x})(y_{i}- | ||
| + | \overline{y})\right)^2} | ||
| + | {{\underset{i=1}{\overset{N}{\sum }}(x_{i}-\overline{x})^{2}} | ||
| + | \underset{i=1}{\overset{N}{\sum }}(y_i-\overline{y})^{2}} | ||
| + | =\rho_{x,y}^2 | ||
| + | </math>, | ||
| + | czyli kwadrat [[WnioskowanieStatystyczne/Momenty#Kowariancja_i_wsp.C3.B3.C5.82czynnik_korelacji|współczynnika korelacji]]. | ||
| − | |||
| − | |||
| − | |||
| − | + | [[Plik:Korelacja.png|600px|thumb|center|<figure id="fig:rozw2"></figure>Przykładowe wartości współczynnika korelacji dla 300 par <math>(x, y)</math> o | |
| − | :< | + | różnych stopniach współzależności. |
| − | + | ]] | |
| − | |||
| − | |||
| − | |||
| − | |||
| − | |||
| − | |||
| − | |||
| − | |||
| − | |||
| − | |||
| − | |||
| − | |||
| − | </ | ||
| − | |||
| − | |||
| − | |||
| − | |||
| − | |||
| − | |||
| − | |||
| − | |||
| − | |||
| − | </math> | ||
Ciekawe przykłady korelacji liniowych dla zależności nieliniowych podaje [https://pl.wikipedia.org/wiki/Zale%C5%BCno%C5%9B%C4%87_zmiennych_losowych artykuł z Wikipedii] | Ciekawe przykłady korelacji liniowych dla zależności nieliniowych podaje [https://pl.wikipedia.org/wiki/Zale%C5%BCno%C5%9B%C4%87_zmiennych_losowych artykuł z Wikipedii] | ||
| − | + | ===Istotność statystyczna współczynnika korelacji=== | |
| − | + | ...to osobny problem :-) | |
| − | |||
| − | |||
Aktualna wersja na dzień 09:37, 30 maj 2025
Wnioskowanie_Statystyczne_-_wykład
Interpretacja współczynnika korelacji
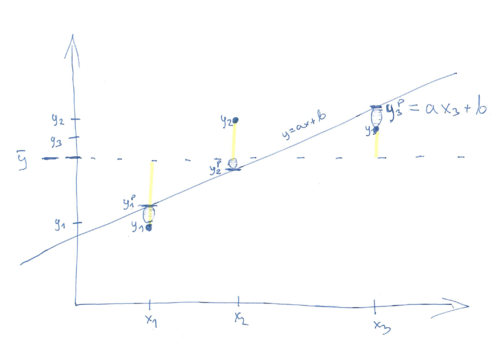
Rozważmy wariancję zmiennej [math]y[/math] z poprzedniego rozdziału. Niech [math]y_{i}^{p}=a+bx_{i}[/math]
[math] \underset{i=1}{\overset{N}{\sum }}(y_{i}-\overline{y})^{2}= \underset{i=1}{\overset{N}{\sum }}(y_{i}-y_{i}^{p}+y_{i}^{p}-\overline{y} )^{2}= [/math] [math] \underset{i=1}{\overset{N}{\sum }}(y_{i}-y_{i}^{p})^{2}+\underset{i=1}{ \overset{N}{\sum }}(y_{i}^{p}-\overline{y})^{2}+2\underset{i=1}{\overset{N}{ \sum }}(y_{i}-y_{i}^{p})(y_{i}^{p}-\overline{y}) [/math]
Całkowitą wariancję zmiennej [math]y[/math] można podzielić na dwa człony: wariancję estymaty [math]y_{i}^{p}[/math] wokół wartości średniej [math]\overline{y}[/math] i wariancję obserwowanych [math]y_{i}[/math] wokół estymaty [math]y_{i}^{p}[/math] (trzeci człon znika):
[math] \underset{i=1}{\overset{N}{\sum }}(y_{i}-\overline{y})^{2}= \underset{i=1}{\overset{N}{\sum }}(y_{i}-y_{i}^{p})^{2}+\underset{i=1}{ \overset{N}{\sum }}(y_{i}^{p}-\overline{y})^{2} [/math]
Współczynnik korelacji liniowej (Pearsona)
Rozważmy stosunek wariancji tłumaczonej przez model do całkowitej wariancji
- [math] S^2 = \dfrac{\underset{i=1}{\overset{N}{\sum }}(y_{i}^{p}-\overline{y})^{2}} {\underset{i=1}{\overset{N}{\sum }}(y_i-\overline{y})^{2}} [/math]
podstawiając [math]y_i^p = a + b x_i[/math] dostajemy
- [math] S^2 = \dfrac{\underset{i=1}{\overset{N}{\sum }}(a + b x_i-\overline{y})^{2}} {\underset{i=1}{\overset{N}{\sum }}(y_i-\overline{y})^{2}} [/math]
Ponieważ [math]\overline{y} = a + b \overline{x}[/math], czyli [math]a=\overline{y}-b\overline{x}[/math],
- [math] S^2 = \dfrac{\underset{i=1}{\overset{N}{\sum }}(\overline{y}-b\overline{x} + b x_i-\overline{y})^{2}} {\underset{i=1}{\overset{N}{\sum }}(y_i-\overline{y})^{2}} = \dfrac{\underset{i=1}{\overset{N}{\sum }}b^2(x_i-\overline{x})^2} {\underset{i=1}{\overset{N}{\sum }}(y_i-\overline{y})^{2}} = b^2\dfrac{\underset{i=1}{\overset{N}{\sum }}(x_i-\overline{x})^2} {\underset{i=1}{\overset{N}{\sum }}(y_i-\overline{y})^{2}} [/math]
Skoro prosta [math]y= a + b x[/math] została dopasowana metodą największej wiarygodności, to [math]
b=\frac{\underset{i=1}{\overset{N}{\sum }}(x_{i}-\overline{x})(y_{i}-
\overline{y})}{\underset{i=1}{\overset{N}{\sum }}(x_{i}-\overline{x})^{2}}
[/math], czyli
- [math] S^2 = b^2 \,\,\, \dfrac{\underset{i=1}{\overset{N}{\sum }}(x_i-\overline{x})^2} {\underset{i=1}{\overset{N}{\sum }}(y_i-\overline{y})^{2}} = \dfrac {\left(\underset{i=1}{\overset{N}{\sum }}(x_{i}-\overline{x})(y_{i}- \overline{y})\right)^2} {\left(\underset{i=1}{\overset{N}{\sum }}(x_{i}-\overline{x})^{2}\right)^2} \;\;\; \dfrac{\underset{i=1}{\overset{N}{\sum }}(x_i-\overline{x})^2} {\underset{i=1}{\overset{N}{\sum }}(y_i-\overline{y})^{2}} [/math]
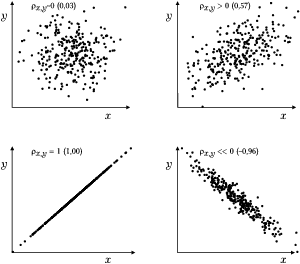
[math] S^2 = \dfrac {\left(\underset{i=1}{\overset{N}{\sum }}(x_{i}-\overline{x})(y_{i}- \overline{y})\right)^2} {{\underset{i=1}{\overset{N}{\sum }}(x_{i}-\overline{x})^{2}} \underset{i=1}{\overset{N}{\sum }}(y_i-\overline{y})^{2}} =\rho_{x,y}^2 [/math], czyli kwadrat współczynnika korelacji.
Ciekawe przykłady korelacji liniowych dla zależności nieliniowych podaje artykuł z Wikipedii
Istotność statystyczna współczynnika korelacji
...to osobny problem :-)

